
Covid-19 outbreak Modelling (March 2020)
The data from the World Health organisation provides some help in understanding the spread of the disease. There are simple ways to analyse these data in an empirical spirit:
Logistic function and complementary Fermi function for simple modelling of the COVID-19 pandemic: tutorial notes, John R Barker, download here: logistic function COVID19
But there are words of caution in taking this too far:
Why your COVD-19 exponential fits are wrong: words of caution and a lesson from catastrophe theory, John R Barker: download here Words of caution
Update: 1st April 2020 : Italy Data
What surpises me is that my fit of a logistic function to the Italian data 5 days ago before their “peak” was realised is remarkably accurate. It will interesting but sad to see how it progresses:
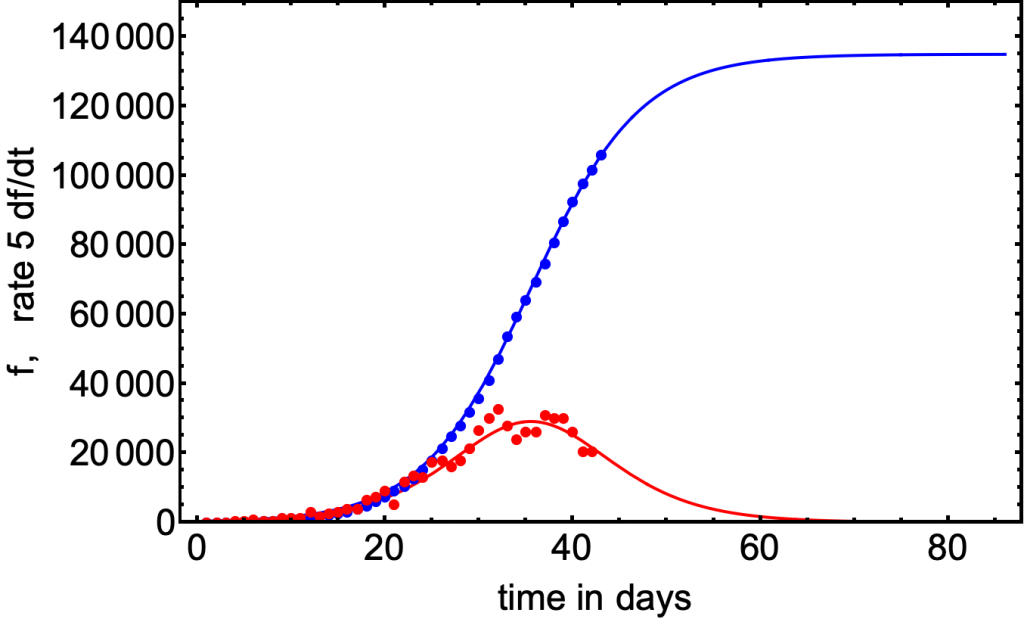
Updated WHO data (blue and red dots) with superposed logistic function(blue curve)/derivative of logistic function(red curve) 3 parameter fit (blue curve.
Update 2: 3rdApril 2020 : Italy Data compared with UK data
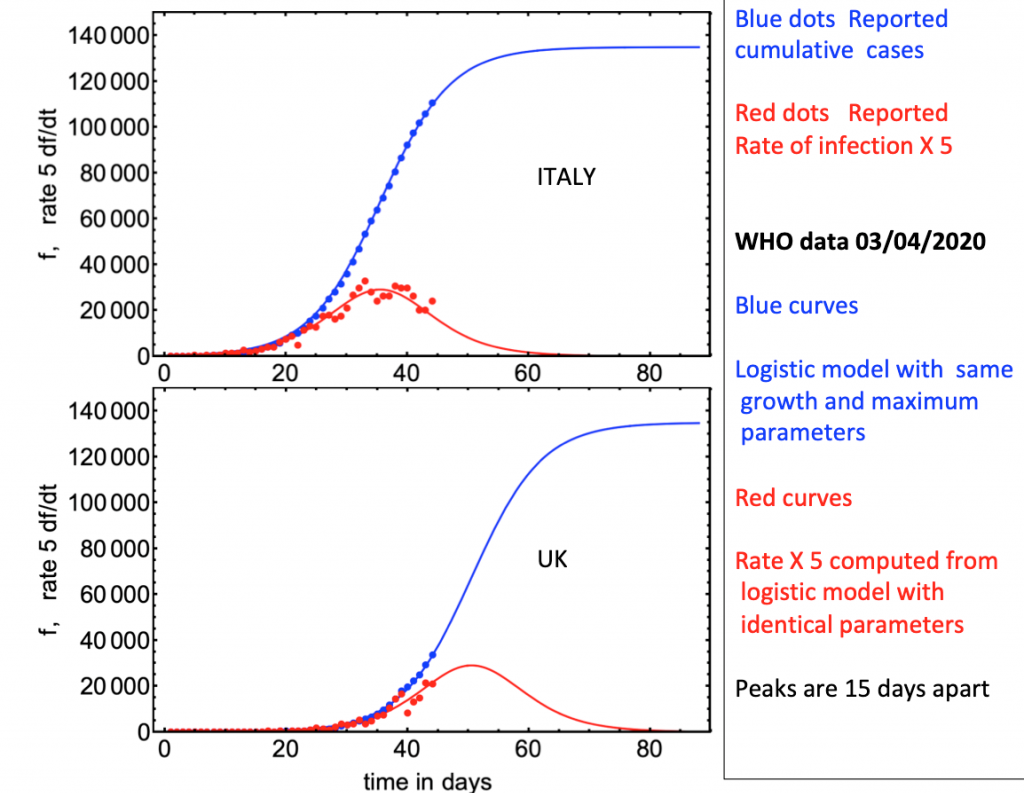
Details here: Download pdf